Here the performance of LoRa Network has been explained. For Matlab code please visit LoRa: SF performance comparison
LoRa uses CSS (chirp spread spectrum) as modulation with a scalable bandwidth of 125kHz, 250kHz or 500kHz.
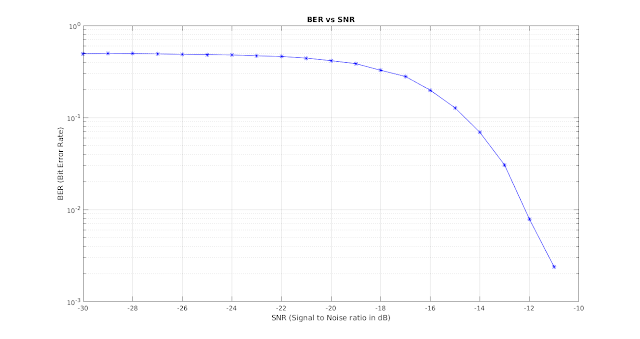
In the system model I used AWGN channel model, BW of 125kHz and spreading factor 10. To encode data in CSS symbol, bits are transmitted to a specific starting frequency of the chirp signal. To decode the CSS symbol, correlation with copy of a base CSS symbol is used to extract the bits based on the phase shift of the signal.
To understand LoRa Symbol generation please read LoRa: Symbol Generation
To understand LoRa decoding please read LoRa Decoding
Following is the simulation result (BER vs SNR curve) for SF 10:
The analytical BER of chirp spread spectrum is as follows:
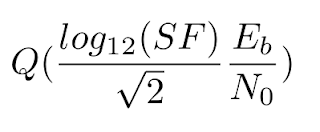
Where
Eb/No is energy per bit to noise power spectral density ratio and
Q(x) is the Q-function.
For the Matlab code of performance comparison of all SF please read LoRa: SF performance comparison
LoRa uses CSS (chirp spread spectrum) as modulation with a scalable bandwidth of 125kHz, 250kHz or 500kHz.
In the system model I used AWGN channel model, BW of 125kHz and spreading factor 10. To encode data in CSS symbol, bits are transmitted to a specific starting frequency of the chirp signal. To decode the CSS symbol, correlation with copy of a base CSS symbol is used to extract the bits based on the phase shift of the signal.
To understand LoRa Symbol generation please read LoRa: Symbol Generation
To understand LoRa decoding please read LoRa Decoding
Following is the simulation result (BER vs SNR curve) for SF 10:

The analytical BER of chirp spread spectrum is as follows:

Where
Eb/No is energy per bit to noise power spectral density ratio and
Q(x) is the Q-function.
For the Matlab code of performance comparison of all SF please read LoRa: SF performance comparison
If you are a research student and want to sell your work on my Blog here, please reach me on sakshama.ghosliya@gmail.com
Could you share the reference for analytical BER of chirp spread spectrum?
ReplyDeleteYou can find it in a conference paper with title "Range and coexistence analysis of long range unlicensed communication" published by "Brecht Reynders, Wannes Meert, Sofie Pollin" in June 2016.
DeleteIf you have direct access to IEEE papers, here is the link: http://ieeexplore.ieee.org/document/7500415/
Hello,
ReplyDeleteSorry, I am posting the message again because of an error.
I run your Matlab code from LoRa: SF performance comparison and compared the results with new ones obtained using the analytical expression given in your post, initially published by Reynders et al. 2016. I expected similar results, but they turned out to be different. As an illustrative example, please see the figure I posted here for a spreading factor of 10 and a bandwidth of 125kHz. The curve in red was computed using the analytical expression while the curve in blue was computed using your Matlab code.
Would it be possible to know the reason for such difference?
Many thanks
I wanted to add that, because the analytical expression takes Eb/N0 as input, I calculate the signal to noise ratio using the following:
DeleteRb = ( sf * bw / ( 2 ^ sf )); % LoRa bit rate
SNR = (Rb * EbNo) / bw; % SNR from Eb/N0
SNR_dB = 10 * log10(SNR); % SNR in dB
The above conversion to plot BER against SNR is the only reason I may think of. The conversion makes sense to me, but I may be wrong.
Thanks, and I am looking forward for your comments.
Hello Sakshama,
ReplyDeleteHow did you convert the Eb/No to SNR? Please share the reference.
Thanks!